Quick Lab
Table of Contents
Spectrophotometry in Medicine.
Spectrophotometry as an estimation problem.
To use artificial intelligence.
Summary
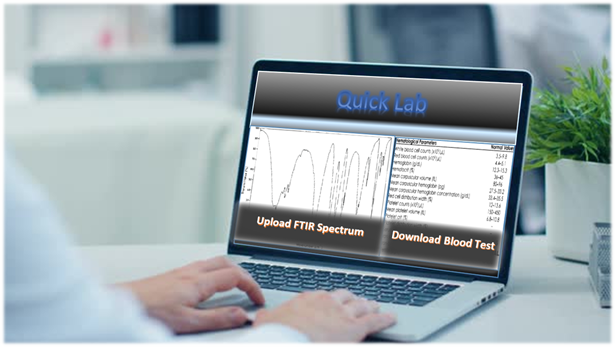
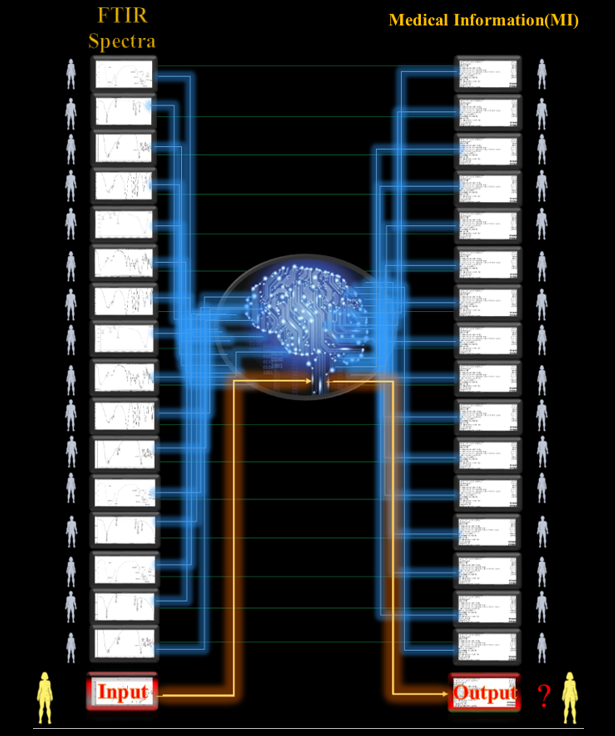
Quick Lab is a website where hospitals upload the FTIR spectra of blood and/or urine and/or saliva (BUS) and download the medical information (blood test result, diseases, gender, age, race, etc.) of the sample owners within a few seconds. To make the website, we need an AI computer program that has learned the correlations between FTIR spectra of (BUS) and medical information. We plan to feed the FTIR spectra (Excel Format) and their medical information in math numbers to the AI program and let the program learn it.
Before going forward, I need to explain today's spectrophotometry and what has been done till now in medicine.
What is spectrophotometry?
This is a spectrophotometer:
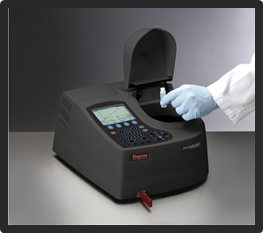
The user puts a sample inside it, and the spectrophotometer emits a range of infrared light to sample. Then spectrophotometer measures the number of photons from each wavenumber that passed through the solution. In this way, spectrophotometer measures the percentage that each wavenumber is absorbed by the solution and gives out a diagram by name FTIR spectrum as below:
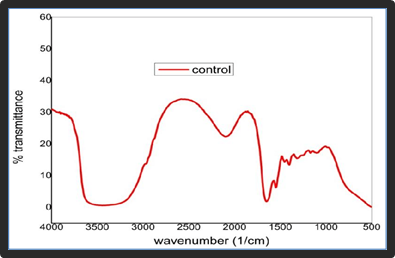
The figure above is an FTIR spectrum of a blood sample. The vertical axis is the absorbance percentage, and the horizontal axis is the wavenumber. FTIR covers the infrared region, and if it is not enough for our purpose, we can add the UV-Visible spectrum to our database. Chemists in the field of spectroscopy try to determine the molecules that exist in the sample; in other words, to characterize that by analyzing the spectrum. The process of spectroscopy is illustrated in the figure below:
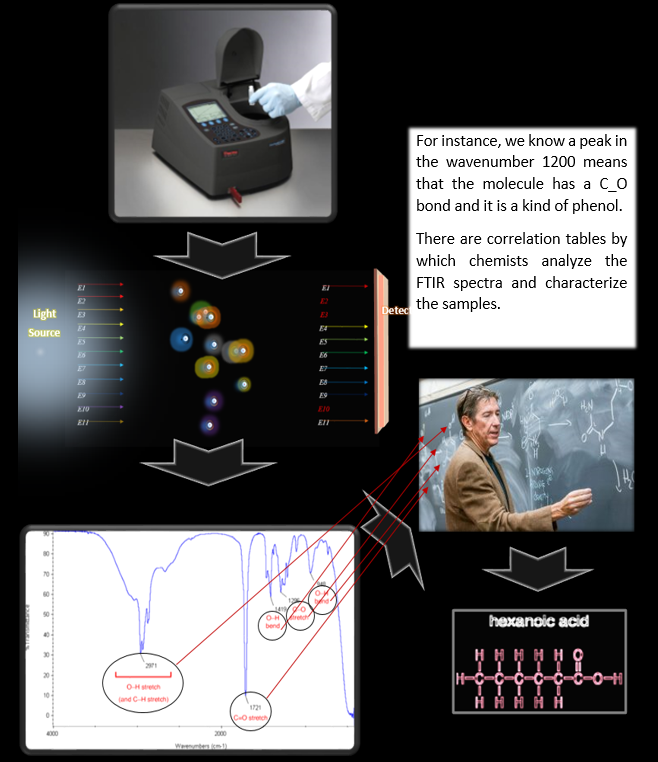
Spectroscopy is applicable in different industries for material analysis and testing; like polymer industry, food, agriculture, etc. Also in medicine, spectroscopy is used to determine the concentration of certain atoms and molecules in blood, urine, and saliva. Early works date back to 70 years ago, and today, blood, urine, and saliva spectroscopy are still an open field of research. Here are some of the articles in the field:Spectroscopy is applicable in different industries for material analysis and testing; like polymer industry, food, agriculture, etc. Also in medicine, spectroscopy is used to determine the concentration of certain atoms and molecules in blood, urine, and saliva. Early works date back to 70 years ago, and today, blood, urine, and saliva spectroscopy are still an open field of research. Here are some of the articles in the field:
DETERMINATION OF VITAMIN E IN BLOOD P. P. NAIR AND M. G. MAGAR
1955
"FTIR-based spectroscopic analysis in the identification of clinically aggressive prostate cancer." M J Baker, E Gazi, M D Brown, J H Shanks, P Gardner and N W Clarke
2008
"Applications of FTIR spectrophotometry in cancer diagnostics." Bunaciu, Andrei A., Vu Dang Hoang, and Hassan Y. Aboul-Enein
2015
Noninvasive Monitoring of Blood Glucose with Raman Spectroscopy Rishikesh Pandey, Santosh Kumar Paidi, Tulio A. Valdez, Chi Zhang, Nicolas Spegazzini, Ramachandra Rao Dasari and Ishan Barman
2017
Critics to current method
There are many articles in the field, also many fake claims, and after 40 years of trial, no one could determine the amount of glucose in the blood. The point is blood is a very complex mixture of compounds; hence it is hard to analyze the spectrum of blood. For instance, it can be so that trace of glucose in men's blood spectrum is different from women's, or in O blood group is different from A. In our method, we consider all the factors into account and let Artificial Intelligence learn the correlations between the FTIR spectrum and the elements and diseases.
Spectrophotometry as an estimation problem
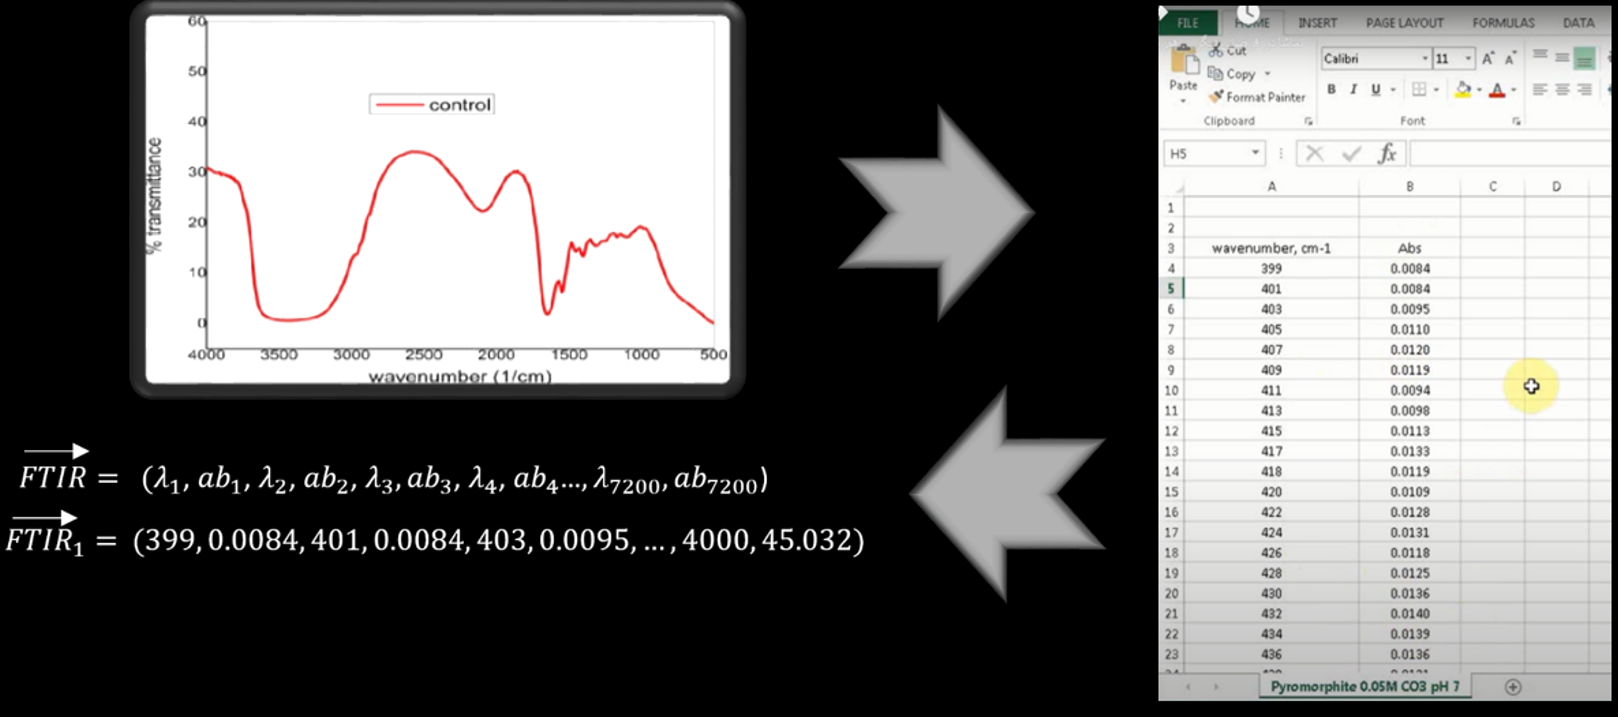
An FTIR spectrum can be imported to excel file. The excel format of an FTIR spectrum for the highest resolution is 3600 pairs of numbers of wavenumbers and absorbance percentages. It can be defined as a vector. So each FTIR spectrum is a vector with 7200 variables, and if we just consider absorbance percentage numbers, this is a 3600-dimension vector.
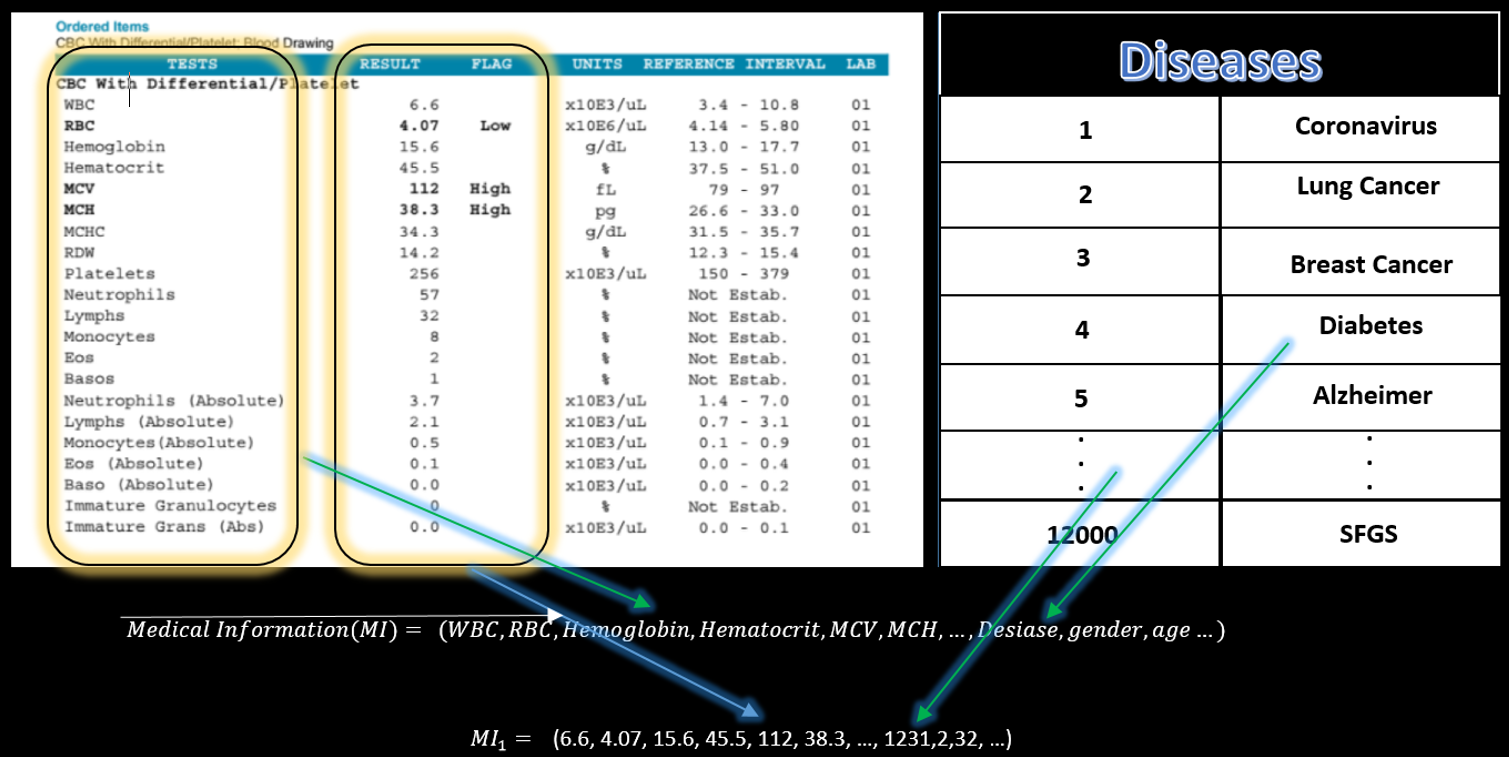
Medical information consisted of “blood test, disease, blood group, gender etc.” also can be defined as a vector.
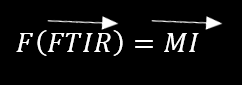
Now we define a function that maps FTIR vector to Medical Information(MI) vector as below:
Suppose we have a large number of (BUS) FTIR spectra and the anonymized medical information of the sample owners; We can write the estimation problem as below:

Estimation theory gives some tools like classical and Bayesian estimation to estimate the value of the BTD vector. In the methods, the value is estimated based on the probability of their presence in the database.
To use Artificial Intelligence
In the field of artificial intelligence, the neural network does the same task and the field of big data specifically focuses on the distinguishing pattern in big data like ours. Artificial intelligence is a powerful tool for estimation. We can feed the Excel format of FTIR spectra and Medical Information(MI) database to the artificial intelligence program; The AI program will learn correlations between medical information and FTIR spectra. Now we have an Artificial Intelligence Program its’ input is the (BUS) FTIR spectra and its’ output is the Medical Information(MI).
There are several methods in artificial intelligence to apply to the problem. These include statistical methods (like the Bayesian classifier), Support Vector Machines (SVMs), and Neural Networks, along with many others. And in the case that Artificial Intelligence fails in learning the spectra, it is still an open math problem; and we can try to solve that by linear algebra and estimation methods or any other mathematical tools. In fact, the tool already exists and we just need to implement it on FTIR spectra and Medical information.
Sample Project
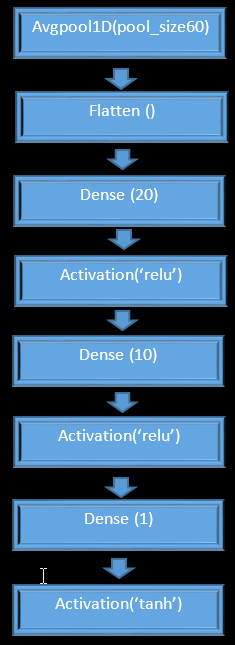
In this sample project, we introduce how our neural network model works on the task of learning the spectra. Two groups of material are considered and a neural network is designed to detect the group of materials based on their spectra. The neural network could detect 75 percent of the cases correctly. Each spectrum was comprised of from 10 to 40 wavenumber with corresponding absorbency coefficients. There were in total 104 spectra, with 57 ester samples and 47 ether samples. The spectra are taken from distinct materials. The data was collected from the Spectral Database for Organic Compounds website. A neural network, as illustrated in Figure below, is used. This is a sequential model. On the first layer, the spectrum is smoothed. This smoothing helps reduce the noise. The second layer flattens the result of the pooling. The data is fed to the rest of the network as a regular fully connected network. The Colab implementation of the network can be downloaded: https://colab.research.google.com/drive/1AFX17GPhe2NyhfK958K6GPfJq3kj8pJd
It is an illustrative project, where we tested the prediction accuracy of a neural network applied on these two categories of materials. Each group has its own distinct characteristics. Although not always apparent, these spectra of a material bears information about such characteristics. It is expected that the neural network extracts the category of a sample by perceiving these hidden characteristics. Such a simple network can detect the category with a 75 percent in accuracy. It is expected that other types of neural network, such as DNN, lead to better results. However, we speculate that better data sets could produce better results too. The data sets that we have used don't cover the full range of wavenumbers. The spectra that we have access to consist of only forty wavenumbers. A real data set needs to contain many more wavenumbers. One more thing to consider is that the chemical groups overlap. This is to say that a compound is not categorized solely by a group, but by a number of groups. For example, most compounds have several bonds that we don’t consider in our project. For example, acetylsalicylic acid (aspirin) has two functional groups (ester and carboxylic acid), and these groups have multiple spectra in FTIR (carbonyl, hydroxyl, ether, c-bond in the ring, carbon double bond). Another reason for the accuracy deficiency problem is that there are different types of groups in the compounds. For example, carbonyl stretch in aliphatic compounds (e.x 2-butanone) shows a peak on 1715 cm-1 but in aliphatic aldehyde (e.x.butyraldehyde) it has the range 1720-1740 cm-1. When we want to analyze the compounds, we must feed all of this information to the neural network, not just some of it. These groups are not given to the network in the current version.
Reference
DETERMINATION OF VITAMIN E IN BLOOD P. P. NAIR AND M. G. MAGAR
1955
https://www.jbc.org/content/220/1/157.full.pdf
"FTIR-based spectroscopic analysis in the identification of clinically aggressive prostate cancer." M J Baker, E Gazi, M D Brown, J H Shanks, P Gardner and N W Clarke
2008
https://www.ncbi.nlm.nih.gov/pmc/articles/PMC2600682/
"Applications of FTIR spectrophotometry in cancer diagnostics." Bunaciu, Andrei A., Vu Dang Hoang, and Hassan Y. Aboul-Enein
2015
https://www.tandfonline.com/doi/abs/10.1080/10408347.2014.904733
Noninvasive Monitoring of Blood Glucose with Raman Spectroscopy Rishikesh Pandey, Santosh Kumar Paidi, Tulio A. Valdez, Chi Zhang, Nicolas Spegazzini, Ramachandra Rao Dasari and Ishan Barman
https://pubs.acs.org/doi/abs/10.1021/acs.accounts.6b00472
2017
